The Journey: How much uplift should you expect from personalized experiences? See benchmarks

As we’ve discussed in our previous post on measuring MarTech ROI , evaluating the impact of tech on business is hard. In this edition of the journey we’ll zoom in on one key component required for this evaluation – uplift. We will show how here at Trendemon we analyze it and reveal some interesting benchmarks and correlations around this topic.
A recent survey by DemandGen Report states that only 10% of B2B marketers think they have an excellent ability to measure and analyze marketing performance and impact. 54% of B2B marketers claim they are being pushed to prove ROI on all marketing investments.
What is uplift and why should you care about measuring it?
In its raw definition, uplift represents the positive effect of a specific “treatment” and how it elevates a metric above its original value. In our specific context of measuring ROI, uplift is what marketers and sales representatives promise that will happen once you start using their product (2X more conversion etc… we sure you’ve heard it before 😉 ).
But it’s one thing to promise uplift, and a completely different matter to measure and prove it. One way of measuring uplift is by measuring “before and after”, when “before” represents a baseline of a metric and “after” is the incremental addition to the baseline value. It is easy but far less accurate – The challenge with time-based uplift measurement, especially with long B2B journeys, is that many different factors can change over time and affect this. This makes it hard to isolate single changes, technologies or activities as responsible for that uplift.
Another approach for measuring uplift is to perform a controlled test: By comparing metric values of a “treatment” group (for example: people who were exposed to a LinkedIn campaign), to a control group (those who weren’t exposed). This way, we can more easily isolate the new activity and measure its effect on the treated vs the control group within the same timeframe. It’s more difficult to execute but in our experience provides more accurate and hence repeatable results.
How we measure uplift
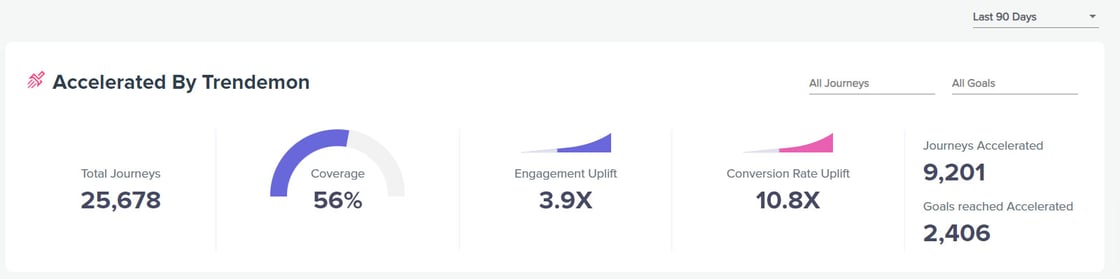
At Trendemon we are making uplift measurements a priority and in our recent update to our dashboard, we are now sharing those figures with our customers. Here’s how we define and measure personalization and orchestration uplift to our customers:First we present some absolute numbers:
* Total number of journeys that were affected by Trendemon’s personalization
* Total number of successful journeys to business goals that were were affected by Trendemon personalization
* Coverage – percentage of journeys that were exposed to Trendemon’s personalization (exposed journeys / total journeys). This metric has a unique impact on uplift – higher coverage (more journeys that are exposed to personalization), leads to an increased potential of uplift, and uplift values will go up accordingly.
Then we break down the uplift analysis. Our approach to measuring uplift is by comparing visitors that have engaged with Trendemon personalization to visitors that haven’t:
* Engagement uplift is the difference in pages read between these two groups.
* Conversion rate uplift is the difference in conversion rates to business goals between the two groups.
Uplift benchmarks
And now, let’s dig into some numbers! We are seeing an average engagement uplift of 3.9X, which means that visitors who engaged with personalized experiences read 3.9X more pages than visitors who don’t.
Average Conversion rate uplift are measured per business goal:
* The average conversion rate uplift to any business goal is 10.8X – visitors who engage with personalized offers and content have a conversion rate which is 10.8X times higher than those that didn’t.
* Average conversion rate uplift for New Qualified Leads is 8.7X.
* An interesting correlation that we’ve observed is that experiences that utilize account-based targeting capabilities achieve a further 27% higher conversion rate uplift compared to non-ABM targeted experiences.
Takeaways
What we’ve learned by measuring our own product uplift is that journey personalization and orchestration work and have a big impact! And the more you invest in, the greater the outcomes. Creating benchmarks helps us compare between different customers, and share playbooks and methods to improve uplift. Here are some key takeaways:
* Personalization matters! And its uplift and impact can (and should!) be measured
* Personalization works even better for account-based use cases
* Personalization uplift is in direct proportion to coverage and needs to be deployed across the entire website in order for it to have a meaningful impact. Personalization of individual landing pages doesn’t match up to optimizing the entire journey.
Want to have a better understanding of your website journeys and how you can achieve uplift at scale? Sign up for a free website audit.